Abstract:
Purpose: The purpose of this study was to utilize the most recently validated method of skeletal age determination, the Tanner-Whitehouse 3 (TW3), to assess the relationship between skeletal age and obesity in pediatric and adolescent patients.
Methods: Data was obtained retrospectively from 103 pediatric and adolescent patients from a
major orthopaedic institution. All subjects assessed for inclusion were healthy patients who had previously underwent left hand radiographs for determination of bone age. Patients were grouped into three different weight-based groups (healthy weight (HW) = BMI < 85th percentile for age, overweight (OW) = BMI 85-95th percentile for age, and obese = BMI >95th percentile for age. Groupings were in accordance with the center for disease control age-specific growth charts. Patients were excluded from the study if there was no recorded height and weight at the time of evaluation, had a growth disorder, skeletal dysplasia, or hormonal imbalance. Bone age was assessed using the TW3 method, and was calculated by one senior orthopaedist in order to keep inter-observer variability as a non-factor. Statistical analysis was performed using ANOVA models to compare each patient group.
Results: The average age of subjects was 11.4 years (11.3 females, 11.5 males), and ranged from 4 to 16 years (52.43% male, 47.58% female). Data was reviewed using gender and weight as the independent variable. When using weight as the independent variable, the observed bone age was seen to be advanced by 18.10 months in obese males, and 8.78 months in obese females (p = 0.007 in males, p = 0.001 in females). In comparison, the observed bone age was 2.65 months delayed in HW males, and 12.66 months delayed in HW females. All results showed statistical significance when bone age was determined from the Radius and Ulna method (RUS). When carpal scores were compared across weight classes, a large advancement in bone age was seen in the obese groups (obese males: 12.92 months, obese females: 11.57 months). Although there was a trend towards significance with p-values of 0.057 and 0.058 for males and females, respectively, the results were slightly shy of significant.
Conclusion: The TW3 method for determining bone age yielded statistically significant differences between healthy and obese patients, with the latter group displaying more advanced bone ages. This study highlights the relationship between level of obesity and advanced skeletal maturation and provides more evidence underscoring the growing importance of proper weight management in the pediatric and adolescent population.
Level of Evidence: Level III Retrospective Comparative Study
J.Orthopaedics 2012;9(2)e8
Keywords:
BMI; obesity; orthopaedics; Tanner-Whitehouse 3; Bone age; pediatric obesity;
Introduction:
The rapidly expanding global epidemic of obesity has begun to affect nearly every westernized nation and has become the most prevalent nutritional problem for children in the United States. The rate of obesity in the pediatric and adolescent population has been rising at an alarming rate, experiencing a near tripling in the incidence over the past thirty to forty years. This trend alone has resulted in an extensive body of literature dedicated to the study of obesity and pediatrics. In turn, the scope of health-related consequences from obesity - such as Blount’s disease, slipped capital femoral epiphysis, increased rates of fracture, and multiple health conditions in adulthood - has become overwhelming. Recently, it has been estimated that the yearly cost of treating obesity-related medical issues in the United States ranges in the billions of dollars.
The relationship between skeletal maturation and obesity has not yet been well-established in the pediatric population, nor with a sufficient sample size to power for statistical significance. , , Skeletal maturation is a complex process involving the differentiation of collagen fibers into cartilage and bone. It is highly variable and utilizes a complex algorithm of environmental factors, growth hormones, and genetics to reach the endpoint of an adult skeleton.8, Many disease processes and pathologic entities cause significant discrepancies in skeletal growth leading to a difference in the skeletal age from chronological age. As such, the ability to assess and quantify skeletal age is of critical importance, especially in the practice of pediatric medicine. Only a handful of studies have successfully demonstrated a relationship between obesity and its impact on the hormonal maturation of the body.8, , Furthermore, only one study has defined a clear correlation between children with precocious puberty and bone age advancement.
Recently, Tristan-Vega and Arribas showed that the least variability in skeletal age from chronological age in both females and males can be established using the Tanner-Whitehouse 3 (TW3) method. The purpose of this study was to utilize the TW3 method of skeletal age determination to assess the relationship between skeletal age and obesity in obese pediatric and adolescent patients.
MATERIALS AND METHODS:
After obtaining Institutional Review Board approval from the host institution, a list of 2,500 pediatric and adolescent patients who had received studies for bone age assessment was obtained by the Department of Radiology’s patient database. All subjects assessed for inclusion in this retrospective study were healthy patients who had previously undergone bone age assessment via left hand radiograph (Figure 1). Patients were excluded from the study if there was no recorded height and weight at the time of bone age evaluation, or if they had any known and documented skeletal dysplasia, hormonal insufficiencies, or other disorders affecting growth. The reasons for referral for the patient to have a bone age examination were vast and included fracture at a sight other than the left hand, parent request, hand pain, wrist pain, or following an insignificant trauma to the hand (ie. fall onto hand). Data was then obtained retrospectively from 103
pediatric and adolescent patients from the NYU Hospital for Joint Diseases Center for Children.
All data were obtained from left-hand plain film radiographs performed specifically for the assessment of bone age. Each hand radiograph was then assessed by the senior orthopaedic surgeon for bone age via the Tanner-Whitehouse 3 (TW3) method. The senior surgeon was blinded to the height, weight, BMI and gender until all results were compiled. The TW3 method provides a specific scoring system that equates each individual growth center with a corresponding letter according to its stage of maturation (Figure 1 – Left hand radiograph).
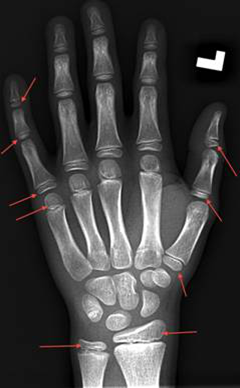
Figure 1: Left Hand Radiograph
Arrows indicate examples of the centers of ossification utilized for the calculation of the RUS score within the premise of the TW3 method.
Each letter value is correlated to a gender-specific standardized numerical value. The TW3 method was chosen over the Greulick and Pyle method due to recent literature supporting lesser intra and inter-observer variability, and greater ease of reproducibility.15 The included growth centers are grouped into two groups - the carpal group and the radius and ulna group. Once overall scores are calculated for each group, a numerical raw score is given representing a bone age.
Growth centers with the radius and ulnar group consisted of the radius, ulna, proximal and distal phalanges of the thumb, and proximal, middle and distal phalanges of the third and fifth metacarpals, and received a radius ulna
score (RUS). The RUS is then given a numerical observed gender-specific bone age determined by the TW3 bone age charts. The growth centers within the carpal scores included all of the bones of the wrist (hamate, capitate, lunate, triquetrium, scaphoid, trapezium and trapezoid, and received a carpal score. The carpal score is then given a numerical observed gender-specific bone age determined by the TW3 bone age charts. All bones of the hand and wrist were carefully assessed one at a time, and given dedicated scores in accordance with the TW3 method.
Statistical analysis was conducted by comparing means via univariate analysis with ANOVA models, where a p-value of <0.05 was taken to indicate significance. All analyses were performed in PASW Statistics 18, Release Version 18.0.0 (=D3 SPSS, Inc., 2009, Chicago, IL, www.spss.com), and were reviewed by a statistician.
RESULTS
A total of 49 females and 54 male patients were included for the study, none of which had a significant past medical history. The study population included 28 obese and overweight females, and 27 obese and overweight males, with the remainder being healthy weight females and males. The average age of all subjects was 11.4 years (11.3 females 11.5 males), and ranged from four to 16 years of age. All data obtained were separated and compared in multiple smaller groups, using several variables as the independent variable to best determine statistical significance of each factor. First, the mean RUS and carpal scores were compared between males and females and their respective weight classes. For males of all weights, the average bone age according to the RUS values was seen to be 6.6 months advanced (p=.007). When all females were averaged according to RUS scores, bone age was seen to be delayed by 5.17 months (table 1).
Gender |
Mean RUS difference by gender
(p= 0.007) |
Mean RUS for levels of weight within gender group |
M
N=54 |
6.6 months |
HW (n=27) -2.65 months
OW (n=11) +13.09 months
OB (n=16) +18.10 months
|
F
N=49 |
+5.17 months |
HW (n=21) +2.66 months
OW (n=10) +11.08 months
OB (n=18) +8.78 months |
Table 1: RUS difference by gender
KEY: M = Male; F = Female; HW = Healthy weight; OW = Overweight;
OB = Obese; += advancement in observed bone age versus chronological age; - = delay in observed bone age versus chronological age |
Results
Excellent result was achieved in 15/19 - 79% (no pain or minimal discomfort, For males and females of all weights, the average bone age according to carpal scores were advanced by 3 and 5.22 months, respectively. The carpal scores seen in obese males and females were equated to a 12.92 and 11.57 month advance in bone age respectively, in comparison to an only one month deviation seen in healthy weight children. These results support a trend in significance.
However, when averaged across all males and all females, the statistical measures were found to fall short of significance, with a p-value of 0.057.
When weight classes were used as the independent variable, gender demonstrated a statistically significant deviation in relation to weight and bone age. The average calculated bone age for healthy weighted subjects was delayed by 6.63 months, negligibly advanced for overweight and 18.10 months advanced for obese subjects (p= 0.001) (Table 2).
Weight level |
Mean RUS difference by weight
(p= 0.001) |
Mean RUS difference for gender within weight level group |
Healthy weight
n=48 |
-2.65 months |
M: -2.65 months, n=27
F: -2.66 months, n=21 |
Overweight
n=21 |
+12.10 months |
M: +13.09 months, n=11
F: +11.08 months, n=10 |
Obese
N=34 |
+13.44 months |
M: +18.10 months, n=16
F: +8.78 months, n=18 |
Table 2: RUS difference by weight level.
KEY: M = Male; F = Female; HW = Healthy weight; OW = Overweight;
OB = Obese; += advancement in observed bone age versus chronological age; - = delay in observed bone age versus chronological age |
Coccygectomy offers high success rate in relieving coccydynia irrespective of the cause. It is more suucceful in the posttraumatic group. However When carpal scores were assessed for correlation with weight class, healthy weight individuals were seen to be negligibly delayed, overweight individuals were seen to be less than three months advanced, and obese were 10.64 months advanced in bone age (p=.058) (Table 3).
Weight level |
Mean Carpal difference by weight
(p= 0.058) |
Mean carpal difference for gender within weight level group |
Healthy weight
n=48 |
-0.23 months |
M: +1.02 months, n=27
F: -1.50 months, n=21 |
Overweight
n=21 |
+3.06 months |
M: +0.86 months, n=11
F: +5.25 months, n=10 |
Obese
N=34 |
+12.25 months |
M: +12.92 months, n=16
F: +11.57 months, n=18 |
Table 3: Carpal difference by weight level
KEY: M = Male; F = Female; HW = Healthy weight; OW = Overweight; OB = Obese;
+= advancement in observed bone age versus chronological age; - = delay in observed bone age versus chronological age |
DISCUSSION
Pediatric obesity is a growing epidemic both within the United States and in many countries throughout the world. With rates of childhood obesity growing at alarming rates,2 physicians must be wary of the metabolic issues prevalent within the obese pediatric patient population. Orthopedic complications resulting from obesity have been well-described in the literature and are a tremendous economic burden. Several studies have described the relationship between bone metabolism and obesity.
Sopher et al. reported that obese children with premature adrenarche displayed increased bone ages, relative to healthy weight children of similar age.14 The researchers also showed that higher than normal levels of estradiol and dehydroepiandrosterone sulfate (DHEAS) appeared to be predictors of advancement in bone age as compared to chronological age. Russell and Keil9 described the relationship between the advancement of skeletal bone age in African American children when compared to Caucasian children. Through their calculations, which used lean body mass and percent body fat, the researchers found that an increase in adiposity was the most significant predictor of skeletal bone age advancement among African American children.
The purpose of this study was to utilize the TW3 method, a recently validated method for assessment of bone age. The TW3 method has been shown to have low inter-observer variability, and the lowest mean error rate.15 A recent study conducted in Sweden performed a meta-analysis of all recent studies of bone age, and found that the TW3 method provided the easiest method for reproducibility. It also demonstrated significantly higher accuracy in bone age calculation than its predecessors. Soon after, Christoforidis et al. directly compared the reliability and accuracy of the TW3 to the Greulich and Pyle (GP) method for prediction of final height and found that the TW3 method was more accurate with a mean absolute error of 3.21 +/- 2.51cm vs. 3.99 +/- 2.99 cm, respectively. However, when accuracy of skeletal age was compared it was determined that both methods were similar in accuracy with a mean age disparity of -0.05 +/- 1.03 years. Further analysis suggests that the TW3 method provides more accurate results than the GP method after the age of 5 years. Combined with the high level of technical skill required to properly employ the GP method, the TW3 test may be a more appropriate analysis because it provides the highest efficacy in an everyday setting.
The results of this study demonstrate statistically significant differences in the observed bone ages derived from the radius and ulna scores, and a trend toward statistical significance in results derived from the carpal scores.
The carpal score outcome was likely due to the significantly earlier maturation that occurs within the bones of the wrist. When compared statistically, a statistically significant relationship was seen between the level of obesity and the advancement in bone age, which was independent of age, sex, or ethnicity. Previous studies have failed to show statistical significance, or have only been able to demonstrate statistically significant results within a limited population, such as African Americans. This study demonstrates the validity of applying the TW3 method among a broader patient population. Furthermore, the TW3 method appears to have minimal variability and a high rate of reproducibility.
There are several limitations of this study. Although statistical significance was demonstrated, greater power could be achieved by assessing the utility of the TW3 method within a significantly larger sample size. This study was retrospective, limiting the study data to information available within patient charts. Lastly, it is difficult to control for other factors that may play a role in the advancement of skeletal age in children with obesity (socioeconomic and behavioral pressures).
Obesity, once thought to be beneficial to bone health, has been shown to have detrimental effects on bone metabolism and growth. Studies have suggested that the decrease in bone mass is likely correlated to an increase in adiposity of the bone marrow at the cost of osteoblastogenesis. However, further research is required to elucidate the nuances of this apparently delicate interrelationship. Moreover, such knowledge may inform interventions and management strategies to prevent skeletal complications from obesity.
Our study revealed a statistically significant relationship between obesity and bone age among children of various ages. Nonetheless, further research is needed in order to investigate the exact mechanism responsible for this advancement in bone age among obese children, including investigations into premature physeal closure in this population.
Proos LA, Lonnerholm T, Jonsson B, et al. Can the TW3 bone age determination method provide additional criteria for growth hormone treatment in adopted girls with earler puberty? A comparison of the Tanner-Whitehouse 3 Method with the Greulich-Pyle and the Tanner-Whitehouse 2 Methods. Horm Res Paediatr 2010; 73:35-40
Christoforidis A, Badouraki M, Katzos G, et al. Bone age estimation and prediction of final height in patients with beta-thalassaemia major: a comparison between the two most common methods. Pediatr Radiol. 2007 Dec; 37(12):1241-6.
Cao JJ. Effects of Obesity on bone metabolism. J Orthop Surg 2011, 6:30.
References:
- Gettys FK, Jackson JB, Frick SL. Obesity in pediatric orthopaedics. Orthop Clin North Am. 2011 Jan;42(1):95-105
- Ogden CL, Flegal KM, Carroll MD, Johnson CL. Prevalence and trends in overweight among US children and adolescents, 1999–2000. JAMA.2002;288:1728– 1732.
- Pirpiris, Marinis Jackson, Kent R.; Farng, Eugene; Bowen, Richard E.; Otsuka, Norman Y. Body Mass Index and Blount Disease. Journal of Pediatric Orthopaedics 26(5), 2006, pp 659-663
- Murray AW, Wilson NI. Changing incidence of slipped capital femoral epiphysis: a relationship with obesity? J Bone Joint Surg Br. 2008 Jan;90(1):92-4.
- Dimitri P, Wales JK, Bishop N. Fat and bone in children: differential effects of obesity on bone size and mass according to fracture history. J Bone Miner Res. 2010 Mar;25(3):527-36
- Van Lenthe FJ, Kemper CG, van Mechelen W. Rapid maturation in adolescence results in greater obesity in adulthood: the Amsterdam Growth and Health Study. Am J Clin Nutr 1996;64:18-24
- Finkelstein, EA, Trogdon, JG, Cohen, JW, and Dietz, W. Annual medical spending attributable to obesity: Payer- and service-specific estimates. Health Affairs 2009; 28(5): w822-w831
- Klein KO, Larmore KA, de Lancey E et al. Effect of obesity on estradiol level, and its relationship to leptin, bone maturation, and bone mineral density in children. J Clin Endocrinol Metab 1998;83:3469–3475
- Russell DL, Keil MF, Bonat SH et al. The relation between skeletal maturation and adiposity in African American and Caucasian children. J Pediatr 2001;139:844–848
- De Simone M, Farello G, Palumbo M, et al. Growth charts, growth velocity and bone development in childhood obesity. Int J Obes Relat Metab Disord 1995;19:851-7.
- Haeusler G, Walter I, Helmreich M, Egerbacher M. Localization of matrix metalloproteinases, (MMPs) their tissue inhibitors, and vascular endothelial growth factor (VEGF) in growth plates of children and adolescents indicates a role for MMPs in human postnatal growth and skeletal maturation. Calcif Tissue Int 2005;76:326–335.
- Wattigney WA, Srinivasan SR, Chen W, et al. Secular trend of earlier onset of menarche with increasing obesity in black and white girls: the Bogalusa Heart Study. Ethn Dis 1999;9:181-9.
- Genazzani AR, Pintor C, Corda R.Plasma levels of gonadotropins, prolactin, thyroxine, and adrenal and gonadal steroids in obese prepubertal girls. J Clin Endocrinol Metab 1978;47:974-9.
- Sopher AB, Jean AM, Zwany SK, et al. Bone age advancement in prepubertal children with obesity and premature adrenarche: possible potentiating factors. Obesity (2011), 19(6):1259-1264
|